February 14, 2019, 3:09 am
DevExpress UniversalComprehensive software development toolset for .NET and JavaScript - including 70+ React Components.
Features
DevExpress has released a maintenance update across their entire product range.
- DevExtreme - DevExtreme for React - 70+ UI and Data Visualization React Components.
- DevExpress ASP.NET - Improves GridView, HtmlEditor, RichEdit, Scheduler Suite and Spreadsheet controls.
- DevExpress Office File API - Improves PDF Document API and Word Processing Document API.
- DevExpress Reporting - Improves Report Designer and Data Source Wizard.
- DevExpress WinForms - Improves Bars, Charts, Grids, PDF Viewer, RichEdit, Reports and Spreadsheet controls.
- DevExpress WPF - Improves Bars, Charts, Editors, Grids, RichEdit, Scheduler and Spreadsheet controls.
↧
February 15, 2019, 2:42 am
Pareto ChartAdd Pareto charts to your dashboards.
Features
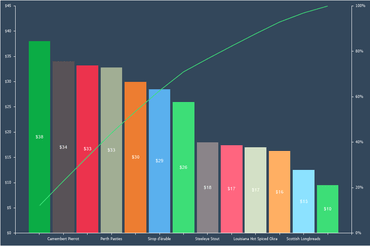
- Pareto Chart - When designing dashboards, you now have the ability to create Pareto charts. This type of chart contains both bars and a line graph, where individual values are represented in descending order by bars, and the cumulative total is represented by the line.
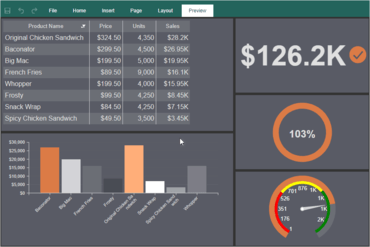
- Top N Values - Chart, Indicator, Progress and Pivot dashboard elements can now display top values.
- Disabling columns in Table - You can now hide columns in dashboard Table elements. In order to apply this, select the data field in the element editor and uncheck the Visible option.
- Hyperlinks in values of a table - You can now set hyperlinks, if the field type is defined as a Dimension, for data field values.
- Interaction - You can now customize interactive actions when viewing the dashboard. Depending on a specific user action, a hint can be displayed, data filtering can be applied, or transition by a hyperlink. Actions can be defined for items such as Chart, Regional Map, and Table.
- Abbreviations in formatting - You can now use abbreviated numbers with numeric and currency formatting in reports or dashboards. For example, for thousands of values you may use the abbreviation K, for millionths M, for billionths B. To enable the use of abbreviations of values, set the checkbox next to Use Abbreviation in the format editor.
- Negative red - Highlight all negative numbers with numeric, currency, and percentage formatting. This functionality will work for both reports and dashboards. To do this, set the checkbox next to Negative in Red in the format editor. Now all numbers that are less than zero will be marked in red.
- Export to JSON - To convert the report, click Save in the report viewer, select the item Data File... and select JavaScript Object Notation (JSON) as the file type. You can export a whole report or data only or data with header and footers.
- Exporting tables to Data - In the dashboard Table element, you now can export data of various types to files. To do this, when viewing the dashboard, click the Save button on the Table element and select the Data item. In the export settings menu, choose the type of data file (CSV, DBF, XML, JSON, DIF, SYLK) to which the contents of the Table element should be converted.
- Export settings - This version adds export settings when exporting dashboards or their elements to various formats. You can change the page size, orientation, image quality, image type and scale. Export settings are displayed in a pop-up dialog, after selecting the export command and before starting the process of converting dashboards or their elements.
- Editing the rendered dashboard - The Edit button has been added to the dashboard preview. This button calls the report designer and opens the rendered dashboard. In the report designer, you can edit the dashboard and save the changes. You will these changes in the viewer.
- Calculation of totals by condition - It is now possible to use the functions of calculated totals with conditions in dashboard elements. The SumIf(,) function is used to sum the data field values by a condition, and the CountIf(,) function is used to count the number of values in a data field by a condition. The first argument in these functions is the data field, and the second is the condition for fetching values.
↧
↧
February 15, 2019, 2:45 am
Top N ValuesChart, Indicator, Progress and Pivot dashboard elements can now display top values.
Features
- Pareto Chart - When designing reports and dashboards, you now have the ability to create Pareto charts. This type of chart contains both bars and a line graph, where individual values are represented in descending order by bars, and the cumulative total is represented by the line.
- Top N Values - Chart, Indicator, Progress and Pivot dashboard elements can now display top values.
- Disabling columns in Table - You can now hide columns in dashboard Table elements. In order to apply this, select the data field in the element editor and uncheck the Visible option.
- Hyperlinks in values of a table - You can now set hyperlinks, if the field type is defined as a Dimension, for data field values.
- Interaction - You can now customize interactive actions when viewing the dashboard. Depending on a specific user action, a hint can be displayed, data filtering can be applied, or transition by a hyperlink. Actions can be defined for items such as Chart, Regional Map, and Table.
- Abbreviations in formatting - You can now use abbreviated numbers with numeric and currency formatting in reports or dashboards. For example, for thousands of values you may use the abbreviation K, for millionths M, for billionths B. To enable the use of abbreviations of values, set the checkbox next to Use Abbreviation in the format editor.
- Negative red - Highlight all negative numbers with numeric, currency, and percentage formatting. This functionality will work for both reports and dashboards. To do this, set the checkbox next to Negative in Red in the format editor. Now all numbers that are less than zero will be marked in red.
- Export to JSON - To convert the report, click Save in the report viewer, select the item Data File... and select JavaScript Object Notation (JSON) as the file type. You can export a whole report or data only or data with header and footers.
- Exporting tables to Data - In the dashboard Table element, you now can export data of various types to files. To do this, when viewing the dashboard, click the Save button on the Table element and select the Data item. In the export settings menu, choose the type of data file (CSV, DBF, XML, JSON, DIF, SYLK) to which the contents of the Table element should be converted.
- Export settings - This version adds export settings when exporting dashboards or their elements to various formats. You can change the page size, orientation, image quality, image type and scale. Export settings are displayed in a pop-up dialog, after selecting the export command and before starting the process of converting dashboards or their elements.
- Editing the rendered dashboard - The Edit button has been added to the dashboard preview. This button calls the report designer and opens the rendered dashboard. In the report designer, you can edit the dashboard and save the changes. You will these changes in the viewer.
- Calculation of totals by condition - It is now possible to use the functions of calculated totals with conditions in dashboard elements. The SumIf(,) function is used to sum the data field values by a condition, and the CountIf(,) function is used to count the number of values in a data field by a condition. The first argument in these functions is the data field, and the second is the condition for fetching values.
↧
February 15, 2019, 2:54 am
Abbreviations in formattingAdds abbreviations in formatting, for example K for thousands.
Features
- Abbreviations in formatting - You can now use abbreviated numbers with numeric and currency formatting in reports. For example, for thousands of values you may use the abbreviation K, for millionths M, for billionths B. To enable the use of abbreviations of values, set the checkbox next to Use Abbreviation in the format edito
↧
February 15, 2019, 2:58 am
Text in cellsAdds new Text in cells component.
Features
- Pareto Chart - When designing reports and dashboards, you now have the ability to create Pareto charts. This type of chart contains both bars and a line graph, where individual values are represented in descending order by bars, and the cumulative total is represented by the line.
- Text in cells - A new component Text in Cells has been added to Reports.JS. You can use this component for designing reports.
↧
↧
February 15, 2019, 3:01 am
Negative redHighlight all negative numbers with numeric, currency, and percentage formatting.
Features
- Pareto Chart - When designing reports and dashboards, you now have the ability to create Pareto charts. This type of chart contains both bars and a line graph, where individual values are represented in descending order by bars, and the cumulative total is represented by the line.
- Negative red - Highlight all negative numbers with numeric, currency, and percentage formatting. This functionality will work for both reports and dashboards. To do this, set the checkbox next to Negative in Red in the format editor. Now all numbers that are less than zero will be marked in red.
- Export to JSON - To convert the report, click Save in the report viewer, select the item Data File... and select JavaScript Object Notation (JSON) as the file type. You can export a whole report or data only or data with header and footers.
↧
February 15, 2019, 3:05 am
Export reports to JSONExport reports to JSON.
Features
- Pareto Chart - When designing reports and dashboards, you now have the ability to create Pareto charts. This type of chart contains both bars and a line graph, where individual values are represented in descending order by bars, and the cumulative total is represented by the line.
- Abbreviations in formatting - You can now use abbreviated numbers with numeric and currency formatting in reports or dashboards. For example, for thousands of values you may use the abbreviation K, for millionths M, for billionths B. To enable the use of abbreviations of values, set the checkbox next to Use Abbreviation in the format editor.
- Negative red - Highlight all negative numbers with numeric, currency, and percentage formatting. This functionality will work for both reports and dashboards. To do this, set the checkbox next to Negative in Red in the format editor. Now all numbers that are less than zero will be marked in red.
- Export to JSON - To convert the report, click Save in the report viewer, select the item Data File... and select JavaScript Object Notation (JSON) as the file type. You can export a whole report or data only or data with header and footers.
↧
February 15, 2019, 3:09 am
Pareto ChartAdd Pareto charts to your reports.
Features
- Pareto Chart - When designing reports, you now have the ability to create Pareto charts. This type of chart contains both bars and a line graph, where individual values are represented in descending order by bars, and the cumulative total is represented by the line.
- Abbreviations in formatting - You can now use abbreviated numbers with numeric and currency formatting in reports or dashboards. For example, for thousands of values you may use the abbreviation K, for millionths M, for billionths B. To enable the use of abbreviations of values, set the checkbox next to Use Abbreviation in the format editor.
- Export to JSON - To convert the report, click Save in the report viewer, select the item Data File... and select JSON as the file type. You can export a whole report or data only or data with header and footers.
↧
February 15, 2019, 3:54 am
Dashboards.JSAdds new customizable data analysis and processing tool for the JavaScript platform.
Features
- New product Dashboards.JS - A powerful, flexible and customizable data analysis and processing tool for the JavaScript platform. All that is needed is a JavaScript and HTML5 browser. Installing additional .NET, Java or Flash components is not required. Therefore, Dashboards.JS will work on most devices (from desktop computers to mobile devices). Dashboards.JS can work as a client-side or server-side solution and the tool is fully compatible with Node.js.
- Pareto Chart - When designing reports and dashboards, you now have the ability to create Pareto charts. This type of chart contains both bars and a line graph, where individual values are represented in descending order by bars, and the cumulative total is represented by the line.
- Top N Values - Chart, Indicator, Progress and Pivot dashboard elements can now display top values.
- Disabling columns in Table - You can now hide columns in dashboard Table elements. In order to apply this, select the data field in the element editor and uncheck the Visible option.
- Hyperlinks in values of a table - You can now set hyperlinks, if the field type is defined as a Dimension, for data field values.
- Interaction - You can now customize interactive actions when viewing the dashboard. Depending on a specific user action, a hint can be displayed, data filtering can be applied, or transition by a hyperlink. Actions can be defined for items such as Chart, Regional Map, and Table.
- Abbreviations in formatting - You can now use abbreviated numbers with numeric and currency formatting in reports or dashboards. For example, for thousands of values you may use the abbreviation K, for millionths M, for billionths B. To enable the use of abbreviations of values, set the checkbox next to Use Abbreviation in the format editor.
- Negative red - Highlight all negative numbers with numeric, currency, and percentage formatting. This functionality will work for both reports and dashboards. To do this, set the checkbox next to Negative in Red in the format editor. Now all numbers that are less than zero will be marked in red.
- Export to JSON - To convert the report, click Save in the report viewer, select the item Data File... and select JavaScript Object Notation (JSON) as the file type. You can export a whole report or data only or data with header and footers.
- Exporting tables to Data - In the dashboard Table element, you now can export data of various types to files. To do this, when viewing the dashboard, click the Save button on the Table element and select the Data item. In the export settings menu, choose the type of data file (CSV, DBF, XML, JSON, DIF, SYLK) to which the contents of the Table element should be converted.
- Export settings - This version adds export settings when exporting dashboards or their elements to various formats. You can change the page size, orientation, image quality, image type and scale. Export settings are displayed in a pop-up dialog, after selecting the export command and before starting the process of converting dashboards or their elements.
- Editing the rendered dashboard - The Edit button has been added to the dashboard preview. This button calls the report designer and opens the rendered dashboard. In the report designer, you can edit the dashboard and save the changes. You will these changes in the viewer.
- Calculation of totals by condition - It is now possible to use the functions of calculated totals with conditions in dashboard elements. The SumIf(,) function is used to sum the data field values by a condition, and the CountIf(,) function is used to count the number of values in a data field by a condition. The first argument in these functions is the data field, and the second is the condition for fetching values.
- Text in cells in Reports.JS - A new component Text in Cells has been added to Reports.JS. You can use this component for designing reports.
↧
↧
February 26, 2019, 4:05 am
Telerik Report ServerMaintenance release includes bug fixes.
Fixes
- Server
- Administrators cannot unlock previously locked report by another user
- Server Manager
- Cannot resolve subscribers with field filtering
- The dropdown for specific asset permission is not readable
- The Reports page does not display the name of the user that has locked a report for editing
- Values in dropdown inputs are not searchable
- Worker count can be set to a negative value
- Engine Common
- Map item tiles are not displayed when map is used in .NET Core and .NET Framework applications
- Designer
- AreaSeries DataPointStyle is not serialized
- Exception is thrown on changing the Report.Language property
- Exception is thrown on reloading the report
- Processing
- ReportProcessor does not resolve relative UriReportSource
- Report's error event is not handling the Barcode item errors
- The thread is not safe when using the same datasource for different reports
- Image Rendering
- Exception is thrown when Barcode item value is invalid
- PDF Rendering
- CIDSet validation fails with some PDF/A-1b validation tools
- Exception is thrown when the report contains WMF or EMF image
- Excel Rendering
- TextBox data format is not recongized correctly
- The date time format is not valid when rendering on an OS with some European cultures
- CSV Rendering
- Only the first rendered Detail section's data appears in a master-detail report
- REST WebAPI
- Cannot add multiple REST report services to a single app
- Expired client appears not expired if the expired data is not collected yet
- Preview
- The splitter disappears after hiding the splitter and refreshing the viewer
- Cannot send e-mail to multiple recipients
- EnableAccessibility option is not respected
- Kendo Editor doesn't focus its editable area when using keyboard navigation
- Menu items have bottom offset
- Missing tab stop for 'select all' and 'clear selection'
- Navigating is not defined error on navigating back
- Page input layout issue on Safari
- Page not found error on scroll
- Report area issue on rendering multiple viewers on a single page
- Report does not get rendered in the viewer's page area
- Report pages are not ordered correctly after visibility action is triggered
- Report pages are rendered with different size while scrolling
- Search and Send Email window position is limited to the viewer bounds
- Search and SendEmail window positions are wrong on window resize
- Search window filter buttons do not fire an action by pressing Enter or Space key
- Send E-Mail CC field is not respected
- The skeleton page is missing
↧
February 26, 2019, 4:06 am
Telerik ReportingAdds report engine support for macOS with .NET Core, plus Crystal Dark theme for WPF Report Viewer.
Features
- Add report engine support for macOS with .NET Core.
- Add WPF Report Viewer Crystal Dark theme.
Fixes
- Installation
- Missing Telerik.Reporting.WebServiceDataSource .NET Standard assembly
- Common
- Map item tiles are not displayed when map is used in .NET Core and .NET Framework applications
- Standalone Report Designer
- AreaSeries DataPointStyle is not serialized
- Exception is thrown on changing the Report.Language property
- Exception is thrown on reloading the report
- Processing
- ReportProcessor does not resolve relative UriReportSource
- Report's error event is not handling the Barcode item errors
- The thread is not safe when using the same datasource for different reports
- Rendering
- Export options are missing when referencing Telerik.Reporting.OpenXmlRendering.2.7.2 for .NET Framework
- Image Rendering
- Exception is thrown when Barcode item value is invalid
- PDF Rendering
- CIDSet validation fails with some PDF/A-1b validation tools
- Exception is thrown when the report contains WMF or EMF image
- Excel Rendering
- TextBox data format is not recongized correctly
- The date time format is not valid when rendering on an OS with some European cultures
- CSV Rendering
- Only the first rendered Detail section's data appears in a master-detail report
- Services
- REST Reports service's report resolver is called in a separate thread
- WebAPI
- Cannot add multiple REST report services to a single app
- Expired client appears not expired if the expired data is not collected yet
- HTML5 Report Viewer
- The splitter disappears after hiding the splitter and refreshing the viewer
- Cannot send e-mail to multiple recipients
- EnableAccessibility option is not respected
- Font Awesome template is not updated
- Kendo Editor doesn't focus its editable area when using keyboard navigation
- Menu items have bottom offset
- Missing icons in search window with Kendo Flat theme
- Missing tab stop for 'select all' and 'clear selection'
- Navigating is not defined error on navigating back
- Page input layout issue on Safari
- Page not found error on scroll
- Report area issue on rendering multiple viewers on a single page
- Report does not get rendered in the viewer's page area
- Report pages are not ordered correctly after visibility action is triggered
- Report pages are rendered with different size while scrolling
- Search and Send Email window position is limited to the viewer bounds
- Search and SendEmail window positions are wrong on window resize
- Search window filter buttons do not fire an action by pressing Enter or Space key
- Send E-Mail CC field is not respected
- The skeleton page is missing
- MVC Report Viewer
- SendEmail options does not contain all available settings
- Web Forms HTML5 Report Viewer
- SendEmail options does not contain all available settings
- Angular Report Viewer
- An error '$.throttle is not a function' is thrown with enabled continuous scrolling
- WPF Report Viewer
- Error on Print Preview when multi-column report has document map
- Missing Telerik.ReportViewer.Wpf.Themes NuGet package
↧
February 26, 2019, 4:09 am
Telerik DevCraft CompleteIncludes latest R1 2019 SP1 releases.
Features
Telerik DevCraft Complete R1 2019 SP1 release includes the following updates:
- Kendo UI + Telerik UI for ASP.NET (MVC & Core), PHP, JSP R1 2019 SP1 - New features for Chat, DateTimePicker, SpreadProcessing, Spreadsheet and ThemeBuilder SASS.
- Telerik Reporting R1 2019 SP1 - Adds report engine support for macOS with .NET Core, plus Crystal Dark theme for WPF Report Viewer.
- Telerik UI for ASP.NET AJAX R1 2019 SP1 - PDF Viewer fit-to-width is now automatically executed when document changes.
- Telerik UI for Silverlight R1 2019 SP1 - GanttView now allows users to navigate backward when editing cells by using the Shift+Tab combination.
- Telerik UI for UWP R1 2019 SP1 - Adds extended type of selection to DataGrid.
- Telerik UI for WinForms R1 2019 SP1 - Includes new features for RadControl, RadLayoutControl, RadPdfViewer and RadScheduler.
- Telerik UI for WPF R1 2019 SP1 - New features for GanttView, GridView, MultiColumnComboBox, RichTextBox, Spreadsheet and TabControl.
- Telerik UI for Xamarin R1 2019 SP1 - PDF Viewer fit-to-width is now automatically executed when document changes.
↧
February 26, 2019, 4:09 am
Telerik DevCraft UltimateIncludes latest R1 2019 SP1 releases.
Features
Telerik DevCraft Ultimate R1 2019 SP1 release includes the following updates:
- Kendo UI + Telerik UI for ASP.NET (MVC & Core), PHP, JSP R1 2019 SP1 - New features for Chat, DateTimePicker, SpreadProcessing, Spreadsheet and ThemeBuilder SASS.
- Telerik Report Server R1 2019 SP1 - Maintenance release includes bug fixes.
- Telerik Reporting R1 2019 SP1 - Adds report engine support for macOS with .NET Core, plus Crystal Dark theme for WPF Report Viewer.
- Telerik UI for ASP.NET AJAX R1 2019 SP1 - PDF Viewer fit-to-width is now automatically executed when document changes.
- Telerik UI for Silverlight R1 2019 SP1 - GanttView now allows users to navigate backward when editing cells by using the Shift+Tab combination.
- Telerik UI for UWP R1 2019 SP1 - Adds extended type of selection to DataGrid.
- Telerik UI for WinForms R1 2019 SP1 - Includes new features for RadControl, RadLayoutControl, RadPdfViewer and RadScheduler.
- Telerik UI for WPF R1 2019 SP1 - New features for GanttView, GridView, MultiColumnComboBox, RichTextBox, Spreadsheet and TabControl.
- Telerik UI for Xamarin R1 2019 SP1 - PDF Viewer fit-to-width is now automatically executed when document changes.
↧
↧
FastReport VCL Enterprise EditionAdds support for Embarcadero RAD Studio 10.3 Rio, new text underlining modes, plus PDF/A-1 PDF/A-3 exports.
Features
- Added new text underlining modes - the text object now allows you to customize the behavior of the underlined text.
- New PDF/A-1, PDF/A-3 export formats have been added to PDF export and the overall PDF export quality is improved.
- Added ability to reflect all objects on the page automatically when building a report - creating RTL reports is now easier.
- Improved work in multi-threaded applications.
- You can now send data to clouds storage without using dialog via application code.
- Added support for the Embarcadero RAD Studio 10.3 Rio.
- Improved FireDAC DB components.
Fixes
- Fixed PDF LineSpacing (for huge values + VAlign).
- Fixed Chinese font names in PDF export.
- Fixed active cell for XLS with several sheets in the BIFF8 export.
- Fixed UTF-8 support for Geodata from DBF.
- Fixed bug when DetailPage(Hyperlink) contains cross bands (bands were not shown).
- Fixed bug in PDF export with transparency in Picture object and KeepAspectRatio property.
- Fixed Clipping of memo object in SVG export.
↧
FastReport VCL Professional EditionAdds support for Embarcadero RAD Studio 10.3 Rio, new text underlining modes, plus PDF/A-1 PDF/A-3 exports.
Features
- Added new text underlining modes - the text object now allows you to customize the behavior of the underlined text.
- New PDF/A-1, PDF/A-3 export formats have been added to PDF export and the overall PDF export quality is improved.
- Added ability to reflect all objects on the page automatically when building a report - creating RTL reports is now easier.
- Improved work in multi-threaded applications.
- You can now send data to clouds storage without using dialog via application code.
- Added support for the Embarcadero RAD Studio 10.3 Rio.
- Improved FireDAC DB components.
Fixes
- Fixed PDF LineSpacing (for huge values + VAlign).
- Fixed Chinese font names in PDF export.
- Fixed active cell for XLS with several sheets in the BIFF8 export.
- Fixed UTF-8 support for Geodata from DBF.
- Fixed bug when DetailPage(Hyperlink) contains cross bands (bands were not shown).
- Fixed bug in PDF export with transparency in Picture object and KeepAspectRatio property.
- Fixed Clipping of memo object in SVG export.
↧
FastReport VCL Standard EditionAdds support for Embarcadero RAD Studio 10.3 Rio, new text underlining modes, plus PDF/A-1 PDF/A-3 exports.
Features
- Added new text underlining modes - the text object now allows you to customize the behavior of the underlined text.
- New PDF/A-1, PDF/A-3 export formats have been added to PDF export and the overall PDF export quality is improved.
- Added ability to reflect all objects on the page automatically when building a report - creating RTL reports is now easier.
- Improved work in multi-threaded applications.
- You can now send data to clouds storage without using dialog via application code.
- Added support for the Embarcadero RAD Studio 10.3 Rio.
- Improved FireDAC DB components.
Fixes
- Fixed PDF LineSpacing (for huge values + VAlign).
- Fixed Chinese font names in PDF export.
- Fixed active cell for XLS with several sheets in the BIFF8 export.
- Fixed UTF-8 support for Geodata from DBF.
- Fixed bug when DetailPage(Hyperlink) contains cross bands (bands were not shown).
- Fixed bug in PDF export with transparency in Picture object and KeepAspectRatio property.
- Fixed Clipping of memo object in SVG export.
↧
FastReport.Net ProfessionalImproves localization support.
Features
- Engine
- Added texture fill.
- Now in the new reports the default font will always be serialized.
- Designer
- Added "Hide Zeros" item to context menu for text objects.
- Added ability to select a style from the context menu.
- Added dialogs for text editor closing; now pressing "X" button will be showed dialog for text changes confirmation.
- Added an ability to sort Data Sources in Data window.
- Added an ability to sort Data Fields in Data window.
- Exports
- Added an ability to escape quotes in CSV export.
- Added PDF digital signature.
- * Word2007 files gets proper locale now (Res.LocaleName).
- WebReport
- Added property WebReport.PdfInteractiveForms.
- Added WebReport.DateTimePickerFormat property, which allows to set the format for the DateTimePicker in WebReport.
- Added editable fields localization.
- .Net Core
- Added function PolyLineObject.SetPolyLine(PointF[] newPoints) that allows to change the set of points.
- Added properties for WebReport Core, which allows to show and hide exports on the toolbar.
- Added WebReport localization.
- Extras
- Updated Arabic resources.
Fixes
- Engine
- Fixed a bug with generation method of barcode Supplement 5 (EAN-5).
- Fixed bug with incorrect type cast in data fields (IMPORTANT! This hotfix may affect previously developed reports).
- Fixed bug with incorrect type cast of Nullable types of fields.
- Fixed a bug with parsing old reports (before 2016), when the Arial 10pt is not loaded in locales jp and zh.
- Fixed a bug with removing serieses of MSChartObject when AutoSeriesColumn is empty and AutoSeriesForce is false.
- Exports
- Fixed a bug with an extra line break in the Word export.
- Fixed loss of a RichText border on export with ConvertRichText option enabled.
- Fixed bug with caps of border lines in PDF export.
- Fix conversion of bold text in RichObject in PDF export.
- WebReport
- Fixed editable fields in tables.
- .Net Core
- Fixed a bug with roslyn wrapper when the warning was raised as an error when using Microsoft.CodeAnalysis version higher than 2.0.
- Fixed a bug with preview in the Online Designer.
↧
↧
FastReport.Net EnterpriseImproves localization support.
Features
- Engine
- Added texture fill.
- Now in the new reports the default font will always be serialized.
- Designer
- Added "Hide Zeros" item to context menu for text objects.
- Added ability to select a style from the context menu.
- Added dialogs for text editor closing; now pressing "X" button will be showed dialog for text changes confirmation.
- Added an ability to sort Data Sources in Data window.
- Added an ability to sort Data Fields in Data window.
- Exports
- Added an ability to escape quotes in CSV export.
- Added PDF digital signature.
- * Word2007 files gets proper locale now (Res.LocaleName).
- WebReport
- Added property WebReport.PdfInteractiveForms.
- Added WebReport.DateTimePickerFormat property, which allows to set the format for the DateTimePicker in WebReport.
- Added editable fields localization.
- .Net Core
- Added function PolyLineObject.SetPolyLine(PointF[] newPoints) that allows to change the set of points.
- Added properties for WebReport Core, which allows to show and hide exports on the toolbar.
- Added WebReport localization.
- Extras
- Updated Arabic resources.
Fixes
- Engine
- Fixed a bug with generation method of barcode Supplement 5 (EAN-5).
- Fixed bug with incorrect type cast in data fields (IMPORTANT! This hotfix may affect previously developed reports).
- Fixed bug with incorrect type cast of Nullable types of fields.
- Fixed a bug with parsing old reports (before 2016), when the Arial 10pt is not loaded in locales jp and zh.
- Fixed a bug with removing serieses of MSChartObject when AutoSeriesColumn is empty and AutoSeriesForce is false.
- Exports
- Fixed a bug with an extra line break in the Word export.
- Fixed loss of a RichText border on export with ConvertRichText option enabled.
- Fixed bug with caps of border lines in PDF export.
- Fix conversion of bold text in RichObject in PDF export.
- WebReport
- Fixed editable fields in tables.
- .Net Core
- Fixed a bug with roslyn wrapper when the warning was raised as an error when using Microsoft.CodeAnalysis version higher than 2.0.
- Fixed a bug with preview in the Online Designer.
↧
FastReport.Net WinFormsImproves localization support.
Features
- Engine
- Added texture fill.
- Now in the new reports the default font will always be serialized.
- Designer
- Added "Hide Zeros" item to context menu for text objects.
- Added ability to select a style from the context menu.
- Added dialogs for text editor closing; now pressing "X" button will be showed dialog for text changes confirmation.
- Added an ability to sort Data Sources in Data window.
- Added an ability to sort Data Fields in Data window.
- Exports
- Added an ability to escape quotes in CSV export.
- Added PDF digital signature.
- * Word2007 files gets proper locale now (Res.LocaleName).
- Extras
- Updated Arabic resources.
Fixes
- Engine
- Fixed a bug with generation method of barcode Supplement 5 (EAN-5).
- Fixed bug with incorrect type cast in data fields (IMPORTANT! This hotfix may affect previously developed reports).
- Fixed bug with incorrect type cast of Nullable types of fields.
- Fixed a bug with parsing old reports (before 2016), when the Arial 10pt is not loaded in locales jp and zh.
- Fixed a bug with removing serieses of MSChartObject when AutoSeriesColumn is empty and AutoSeriesForce is false.
- Exports
- Fixed a bug with an extra line break in the Word export.
- Fixed loss of a RichText border on export with ConvertRichText option enabled.
- Fixed bug with caps of border lines in PDF export.
- Fix conversion of bold text in RichObject in PDF export.
↧
FastReport.Net WinForms + WebFormsImproves localization support.
Features
- Engine
- Added texture fill.
- Now in the new reports the default font will always be serialized.
- Designer
- Added "Hide Zeros" item to context menu for text objects.
- Added ability to select a style from the context menu.
- Added dialogs for text editor closing; now pressing "X" button will be showed dialog for text changes confirmation.
- Added an ability to sort Data Sources in Data window.
- Added an ability to sort Data Fields in Data window.
- Exports
- Added an ability to escape quotes in CSV export.
- Added PDF digital signature.
- * Word2007 files gets proper locale now (Res.LocaleName).
- WebReport
- Added property WebReport.PdfInteractiveForms.
- Added WebReport.DateTimePickerFormat property, which allows to set the format for the DateTimePicker in WebReport.
- Added editable fields localization.
- Extras
- Updated Arabic resources.
Fixes
- Engine
- Fixed a bug with generation method of barcode Supplement 5 (EAN-5).
- Fixed bug with incorrect type cast in data fields (IMPORTANT! This hotfix may affect previously developed reports).
- Fixed bug with incorrect type cast of Nullable types of fields.
- Fixed a bug with parsing old reports (before 2016), when the Arial 10pt is not loaded in locales jp and zh.
- Fixed a bug with removing serieses of MSChartObject when AutoSeriesColumn is empty and AutoSeriesForce is false.
- Exports
- Fixed a bug with an extra line break in the Word export.
- Fixed loss of a RichText border on export with ConvertRichText option enabled.
- Fixed bug with caps of border lines in PDF export.
- Fix conversion of bold text in RichObject in PDF export.
- WebReport
- Fixed editable fields in tables.
↧